A faster 3D view, part 1: measure first
A bookcase has 9 parts. A fitted kitchen of 100 units has 3,591. We want both to feel the same when you turn them round and change them.
This is the first of two posts about how we are getting there. It covers what we read, how we measured, what we found and what we fixed. Part 2 covers the work that is still to come.
The problem#
Big models went wrong in three ways.
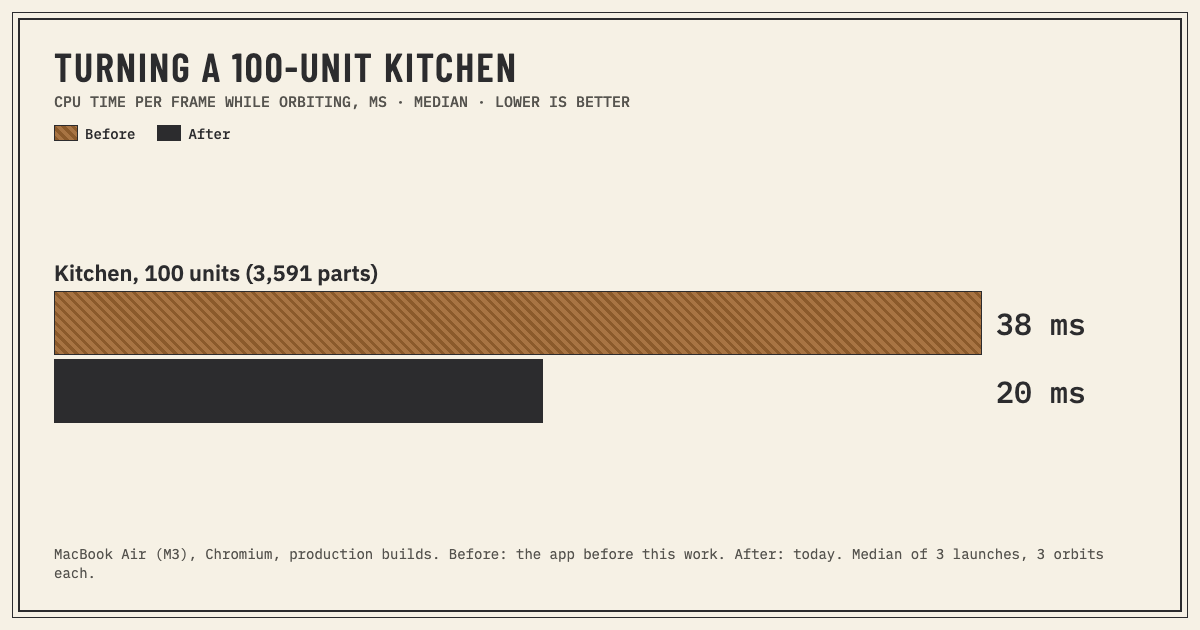
- Turning the model felt sluggish. A kitchen of 100 base units needed about 38 ms of CPU time for each frame. The CPU is the computer's main processor. So the kitchen turned at about 25 frames a second at best.
- Edits froze the page. On the same kitchen, moving one part took 440 ms to show, and the page couldn't respond for most of that time.
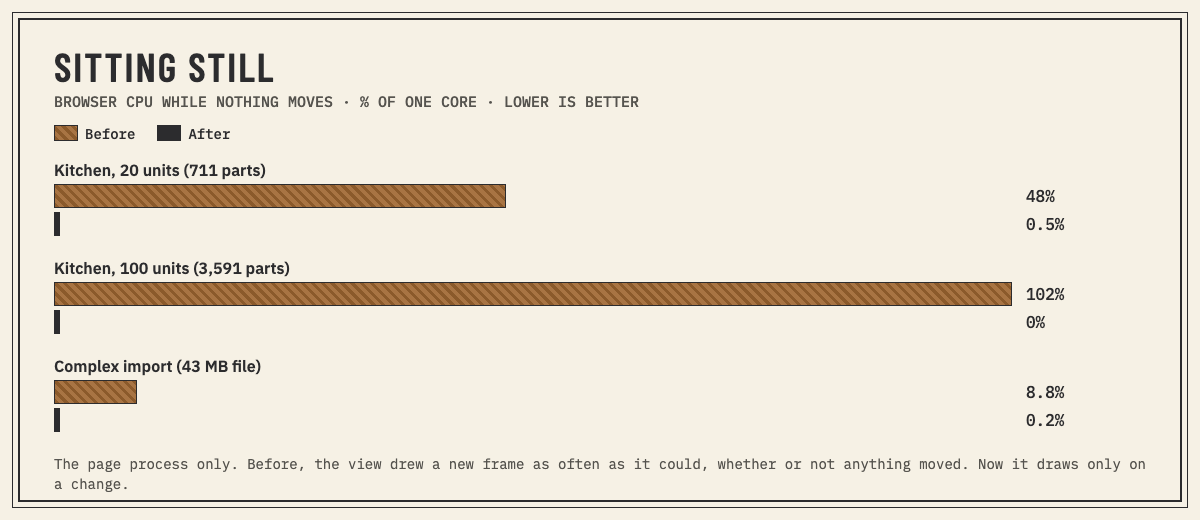
- The computer stayed busy while nothing moved. With the model on screen and your hands off the mouse, the browser kept one CPU core fully busy. On a laptop, that is battery and fan noise for nothing.
A design partner brought us a different case: a complex 43 MB model, imported as a user would. It has only 28 parts, but 26 textures of 4096 × 4096 px. It turned smoothly, but hiding one part took 130 ms. The import froze the page for 2 s.
What the research says#
Before we changed anything, we read how other web CAD viewers handle big models, and what studies say people notice.
How many frames a second a CAD app needs depends on what moves.
- When you turn the camera, your viewpoint moves. Ware and Balakrishnan found that lag in the viewpoint matters much less than lag in an object your hand moves (1994).
- Janzen and Teather ran a study where people selected targets. Performance was 14% better at 60 frames a second than at 30, but they found no significant difference between 45 and 60 (CHI 2014).
- Lag hurts most when you aim at small things. MacKenzie and Ware saw movement time rise 64% at 225 ms of lag (CHI '93). Studies of games point the same way: actions that need speed and precision suffer at low frame rates, general movement much less (Claypool).
So these are our targets. While you orbit, pan or zoom, a steady 30 frames a second is acceptable. While you drag a part, aim for 60, with less than about 50 ms from your hand to the screen. When nothing moves, draw nothing.
The other viewers we read about don't draw at full quality all the time. The xeokit viewer hides edges and draws fewer pixels while the camera moves. It restores full quality 0.5 s after the camera stops (FastNavPlugin).
React Three Fiber is the library we draw with. Its guidance is to draw only when something changes, and to use "at most 1000 draw calls" (scaling performance). A draw call is one request from the CPU to the graphics chip (the GPU) to draw something. One web CAD app measured what drawing while idle costs: 64% CPU before it switched to drawing on demand, 0.1% after (vcad).
A browser can measure less than we hoped, and most of it only in Chromium, the browser engine inside Chrome and Edge.
- Frame times from the browser's animation callback work everywhere, but only while something draws. They can't tell CPU time from GPU time.
- GPU timer queries split the two, but few browsers have them. They are in about 81% of Chrome sessions, 0.2% of Safari sessions and 0.05% of Firefox sessions (web3dsurvey).
- Long Animation Frame timing, which reports frames over 50 ms and the scripts that ran in them, is in Chrome and Edge only.
- Hints such as device memory are in Chromium only, and capped at 8 GB (MDN).
That is enough to find problems on our own machines. It is not yet enough to tune quality for every reader's device.
How we tested#
A real GPU, in a window you can see. Browser tests usually run headless, with no window. Headless Chromium often draws with SwiftShader, a software renderer that runs on the CPU. That turns every GPU cost into a CPU cost, so it would hide the thing we wanted to find.
So we ran Chromium in a visible window, on the laptop's own GPU, through Apple's Metal graphics layer. We checked the renderer name in each run to be sure.
Repeatable scenes. A script builds each scene through the app's own commands, so every run starts from the same model:
| Scene | What it is | Parts |
|---|---|---|
| 20 units | Kitchen base units with shaker doors, drawers and bar handles | 711 |
| 100 units | 100 of the same units | 3,591 |
| Complex import | A complex 43 MB model, imported as a user would | 28, with 26 textures of 4096 × 4096 px |
For the edit tests, every unit takes its width and depth from two shared settings, so one change resizes all of them. That version of the 100-unit kitchen has fewer drawers: 2,200 parts.
One change at a time. We measured each fix on its own, against the version before it, with the same scenes and the same script.
Medians of repeats. Every number in this post is a median. The drawing test opens the browser 3 times, and each time turns the model for 5 s, 3 times over. The edit test repeats each edit 4 or 5 times in each of 3 runs.
One benchmark at a time. Several of us, people and coding agents, run benchmarks on the same laptop. A shared lock makes each run wait until the one before it ends, so two runs never compete for the CPU or the GPU.
For this post, we measured again. We made production builds of the app as it was before this work and as it is today. We ran the same scripts against both on the same morning.
What we found#
Big kitchens were limited by draw calls on the CPU, not by pixels on the GPU. The 100-unit kitchen sent 10,777 draw calls a frame: one for each material of each part, plus one for each part's outline. Preparing and sending them took about 38 ms of CPU time per frame. The GPU needed 16 to 24 ms.
So drawing fewer pixels didn't help. At half the resolution the GPU time halved, but the frame took only 2% less time.
Surprise 1: the outlines were three quarters of the triangles. Every part had its own outline: a line a few pixels wide, drawn as a strip of about 200 triangles, with its own draw call. The outlines were a third of the draw calls and 75% of the triangles. With them off, a frame took 46% less time.
But without outlines, drawer gaps and shaker frames lose their shape. So we kept them and changed how we draw them.
Surprise 2: every edit redrew every part. Each edit made a new copy of the whole design. To the interface, every part then looked new, including parts the edit didn't touch.
A mesh is the set of triangles that draws a part. To re-render is to work out again what a part should draw. Moving one part re-rendered all 2,200 part meshes.
Surprise 3: a quadratic loop. That is a loop whose work grows with the square of the number of items. To find the box around an assembly, the app searched the whole design for that assembly's children, then did the same for each child. On 2,300 items that is millions of checks, and it ran on every edit: about 310 ms of the 440.
Surprise 4: whole-design copies. Every command copied the whole design and compared the copy with the old one as text, even commands that change nothing, such as a selection. The design keeps the complex import's 43 MB file as text, and text takes about a third more space: 58 MB. So one click on "hide" copied 58 MB.
Surprise 5: a crash that only developers saw. In a development build, the first edit on the 100-unit kitchen froze the page for 39 s, and hiding a part crashed the browser tab. React is the library that builds our interface. Its development builds record how each component's inputs changed, for its profiler, a tool that shows where the time goes.
Each of the 3,591 part meshes got the whole design as an input. React compared it three levels deep for every one of them. The page grew by about 2 GB and ran out of memory.
Production builds don't record this, so users never saw it, but it made big models impossible to debug. Parts now read the design from a shared source instead of an input of their own.
Rust and WebAssembly weren't the answer. WebAssembly lets a browser run code written in languages such as Rust. We checked each hotspot against that idea:
- The quadratic loop is an algorithm bug. An index in plain JavaScript fixes it.
- The copying and comparing already ran in the browser's native code. The fix is to stop doing them.
- Re-rendering is work in React and three.js, our 3D drawing library, that WebAssembly can't reach.
- Manifold, the library that cuts and joins our solid shapes, is already WebAssembly. Its problem is where it runs, not what it is written in.
Most of the gains came from not doing work at all.
What we improved#
The view draws only when something changes. Before, it drew new frames as fast as it could, whether or not anything moved. Now it draws when the camera, the model or an animation changes. A door that swings open asks for frames until it stops, then the view goes quiet.
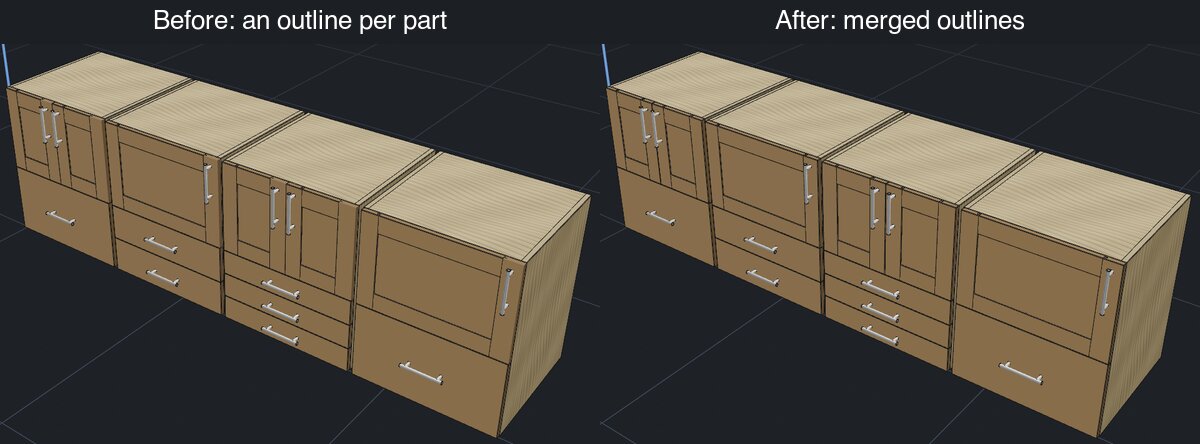
Outlines are merged. Instead of one outline per part, the app draws one outline per assembly and colour. A selected part gets an outline of its own, so selecting doesn't rebuild the merged one. Identical units share their outline geometry, so 100 identical units work it out once.
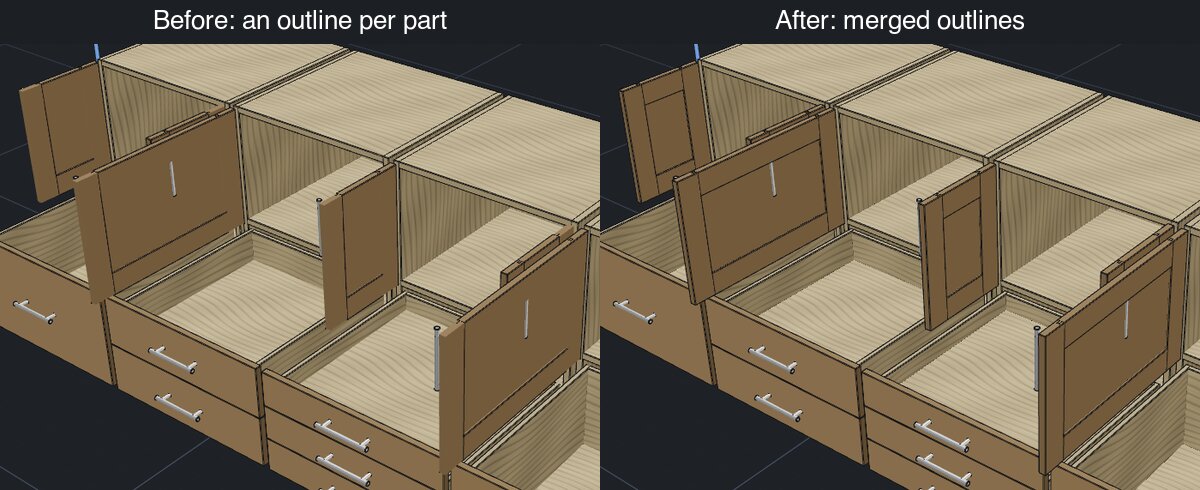
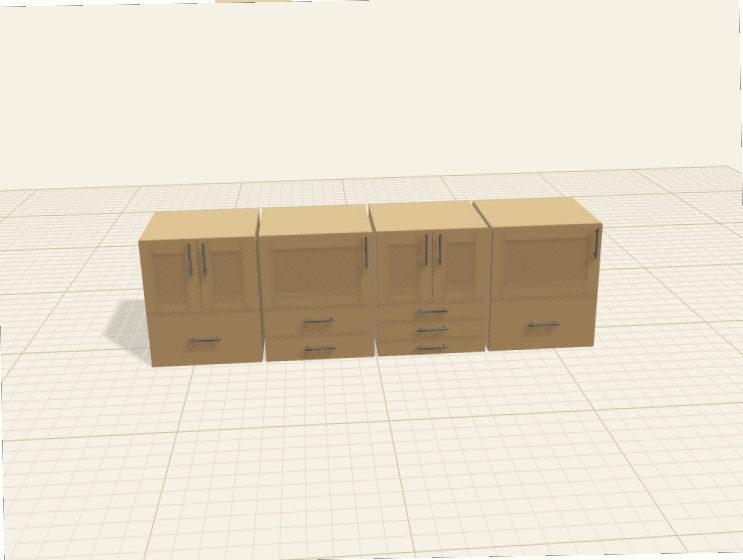
Merging also fixed a bug. The old outlines didn't update after the grooves of a shaker door were cut, so some groove lines were missing. You can see it with the doors open:
Together, these changes brought the 100-unit kitchen from 10,777 draw calls a frame to 7,286, and nearly halved the CPU time per frame. There are more triangles now (1.18 million, up from 1.05 million), because the groove lines are back. The GPU still finishes first.
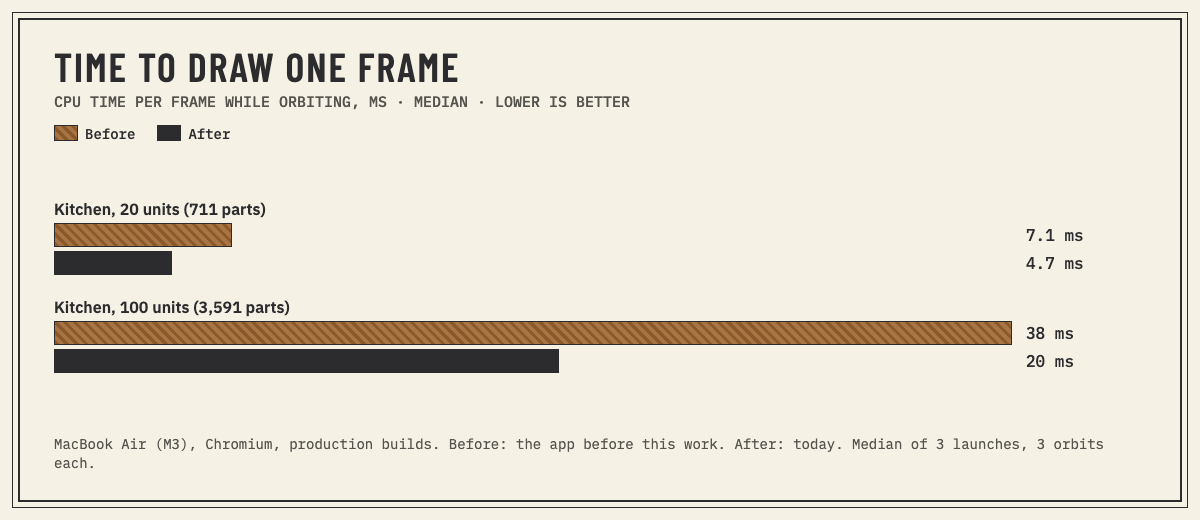
The complex import needed less than half a millisecond of CPU time per frame before and after, so it isn't in the chart.
Edits touch only what changed. Commands that don't edit the design no longer copy it. An edit shares every unchanged part with the version before it, imported model data included. Each part mesh re-renders only when something it draws changes: moving one part re-renders one mesh, not 2,200.
The quadratic loop is linear: its work now grows in step with the number of items. Once per edit, the app builds an index of which item sits in which assembly, and walks it. The model tree and wall shapes had their own copies of the slow search, and got the same fix.
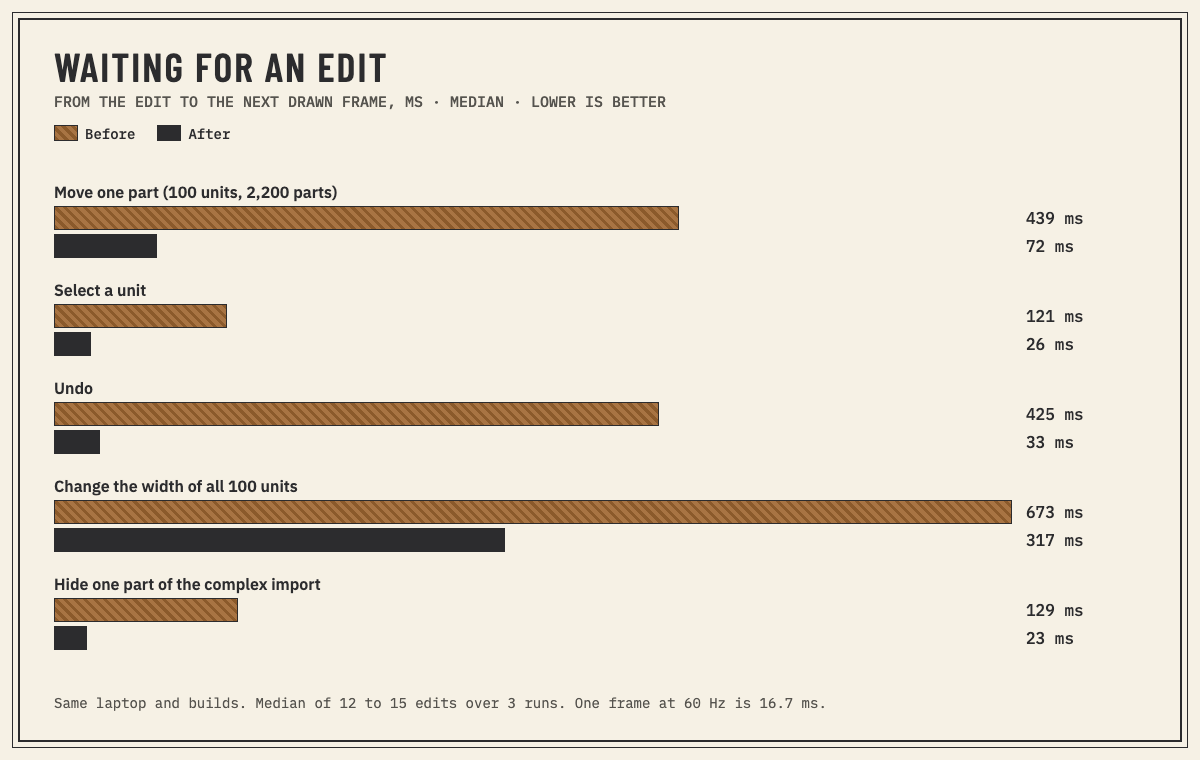
All the numbers, before and after, on the same laptop:
| Before | After | |
|---|---|---|
| 100 units, drawing (3,591 parts) | ||
| CPU time per frame, orbiting | 38 ms | 20 ms |
| Draw calls per frame | 10,777 | 7,286 |
| Frames drawn per second, idle | 26 | 0 |
| Browser CPU, idle | 102% | 0% |
| 100 units, editing (2,200 parts) | ||
| Move one part | 439 ms | 72 ms |
| Move a unit | 438 ms | 49 ms |
| Select a unit | 121 ms | 26 ms |
| Undo | 425 ms | 33 ms |
| Change the width of all 100 units | 673 ms | 317 ms |
| Open the project | 1,704 ms | 565 ms |
| Complex import (43 MB) | ||
| Hide one part | 129 ms | 23 ms |
| Import, from file to drawn | 3.5 s | 2.7 s |
| Browser CPU, idle | 8.8% | 0.2% |
Edit times run from the command to the next frame on screen, so they include drawing one frame. On the 20-unit kitchen, most edits were already under 30 ms and moved by a few milliseconds.
What's next#
Some big costs remain. Part 2 is about these:
- Heavy work off the main thread. Changing the width of 100 units still takes 317 ms, because every unit is rebuilt. Manifold also cuts the grooves and handle holes again, on the same thread the page runs on. That work can move to a background worker.
- Lighter saves for imported models. After each edit, the complex import's 58 MB of text is saved to the browser's storage again. Reopening it still takes about 3 s, most of it uploading 26 large textures to the GPU. We expect that storing imported files once and making their textures smaller will remove both pauses.
- Quality that adapts to the device. We want a steady frame rate on slower laptops too. For example, we could draw outlines and shadows only while the camera is still. We also want a way to notice a struggling device from its frame times.
Turn it yourself#
What we didn't measure#
All the numbers come from one laptop, a MacBook Air with an M3 and 24 GB of memory, in Chromium, on a 60 Hz screen. We haven't tested Safari, Firefox, Windows, a 120 Hz screen or a laptop with integrated graphics yet. We took no battery readings.
We couldn't measure GPU memory: the complex import's textures need an estimated 2 GB at full size, but this GPU doesn't report it. The edit tests ran commands from a script. Real input, such as dragging a part with the move tool or typing a value, wasn't part of them.